Ace Hoffman: World's Most Prolific Artist! Discusses chaos: Pseudo-Randomly-Generated Art
The Use Of Random Numbers in Computer Art
Below are "samples" of RANDOM COMPUTER ART which I create in the early 1980's using the computer language called BASIC and a Panasonic six-pen plotter, and an NEC laptop computer similar to the famous TRS-100. My unique procedure was written about in Clifford Pickover's JOURNAL OF CHAOS AND GRAPHICS some years ago.
Each drawing is completely unique because the program that creates them uses hundreds--sometimes thousands--of random numbers (actually, psuedo-random numbers) to decide precisely how big, what color, and where shapes will be placed. Leaves on trees are randomly placed as are the branches. Houses are of random width but a standard height.
The pine trees and most other images are purely mathematical constructs and are computer generated. The round tree images in one type of drawing were originally drawn on the computer and then the exact locations and other features were randomized.
Some of these patterns take minutes to draw while others take over an hour. The longest any ever took was over twelve hours, at which point the plotter overheated or something and stopped working for a day, and was never really the same since.
There are currently about five basic patterns. I have given away around 20,000 of these drawings and each one is believed to be unique (though good luck proving it!) This possibly makes me the world's most prolific artist in history! Interestingly, when I lay out a hundred or so of these drawings on a table at a computer show or something, people will often sort through the WHOLE pile and pick out the ONE that they like the best--but all of them are eventually picked! Even with keeping the pile at around 100 pictures all day long, no picture ever stayed on the table all day. If I lay out 200 drawings instead of 100, people will still sort through them all--and it takes too long so I limit it to a hundred at a time! I really think this says something very interesting about "art" and the perception of beauty, and the need for diversity.
This concept can be applied to building rows of real houses as well, or to paint schemes for cars, and to thousands of other everyday things. Thanks to the computer, we need not live in a dull world where everything is the same, dull and lifeless. Furthermore, we can more easily experiment with different designs to find out people's average preference, and the degree of variation of preference.
Below the images is a BASIC program which creates the "bouncing line" drawing type. The other programs are essentially the same kind of code, but quite a bit fancier. You are encouraged to use the concepts suggested in the code to develop your own use of random numbers and random images.
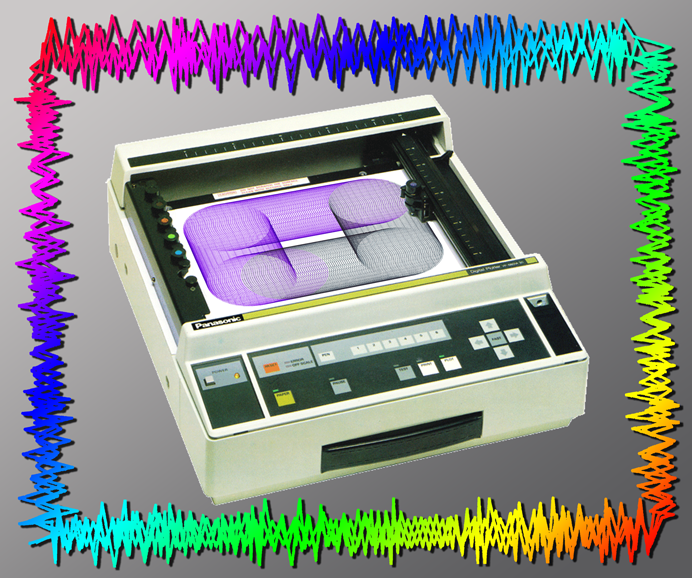
Here are some samples of "random" drawings. These were scanned in at high resolution in 2019 (=600 DPI), but were created in the 1980s using the printer shown in the lower right image (which has a random border that was later rainbow-colorized and a drop-shadow added in Photoshop). Notice the time shown in the first drawing on the left -- it took about an hour and a half to draw that simple image! Ah, how times have changed! Also, notice, in the same drawing, a certain lack of randomness in the placement of the bordering starts. This was due to the early computer's random number generator being, well, not sufficiently random!
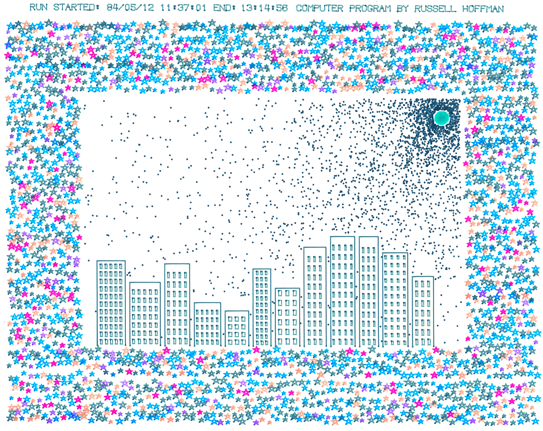
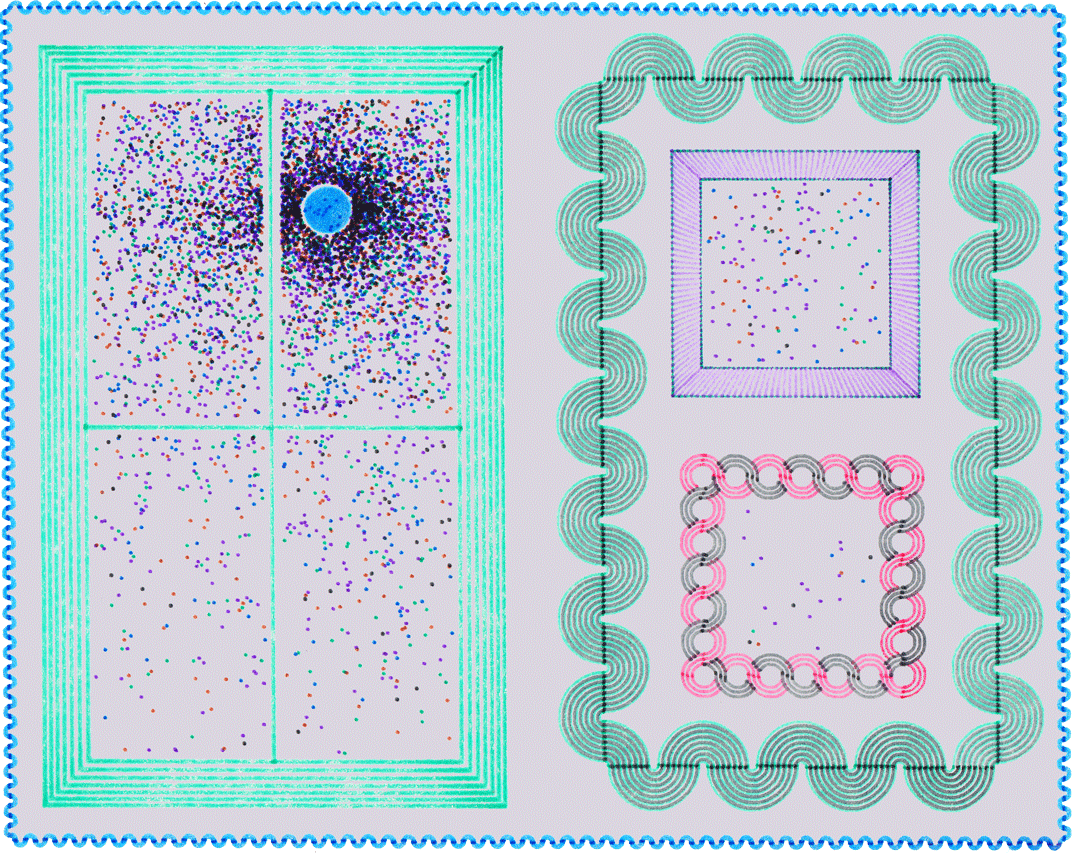
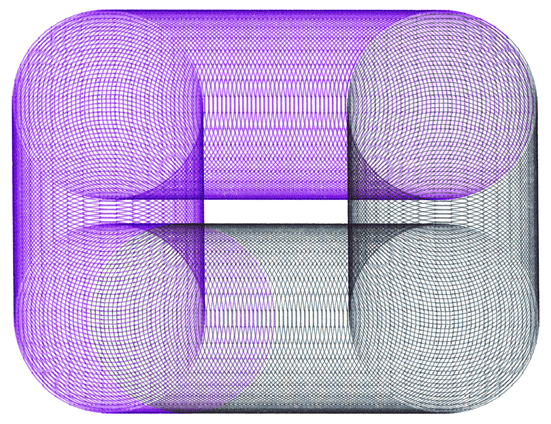
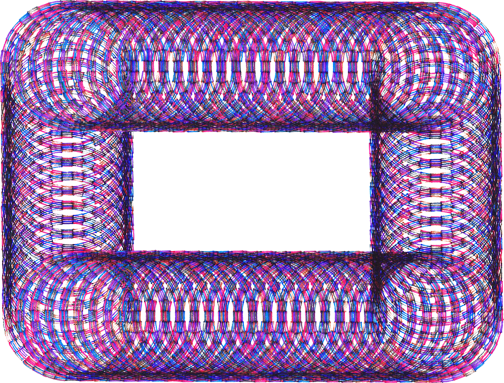
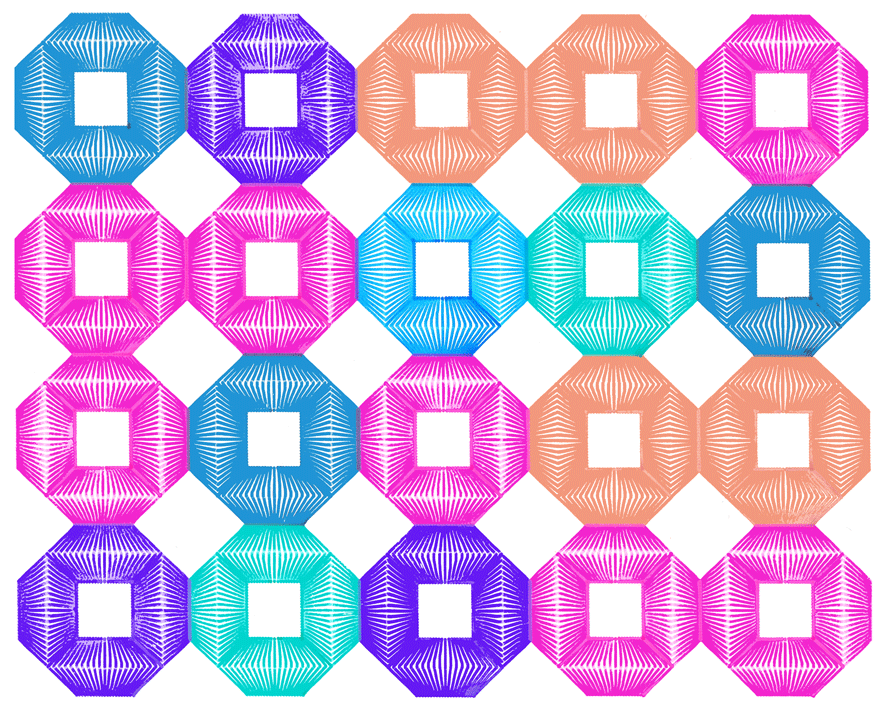
Below we scanned in two sets of four images each available to view. Remember, these are NOT being generated right now just for you, but with a bit more sophisticated Internet programming skills, they probably could be, however for the complex ones it would also probably take too long to do it that way! Also, note that using the Panasonic six-pen plotter produced much nicer looking original images.
These images have been scanned in with an HP ScanJet 4c color scanner at 75 DPI and 256 colors. Then the images were brought into Corel Paintbrush and rescaled to 40% of original size at 60 DPI. This made the files each only about 8K in size. There are four sets of four images each.


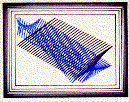
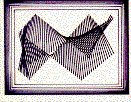
Below is the actual code used to draw a "bouncing line" pattern (the last of the four patterns show above.)
Feel free to use the ideas developed in it. If you use the code unchanged, please credit Animated Software Company as the author of the program.
The program shown below was written back when every byte counted for space so please bear with its "ancient" dialect! Note that some of the LPRINTs are specific for the Panasonic digital plotter, but most just write the image and would be essentially the same in any language.
First the decision is made which of four positions to draw first, not that that makes a whole lot of difference. Next the border is drawn, in lines 140 to 170. Then the inner "bouncing line" is drawn.
The following program is copyright (c) 1984 by Ace Hoffman.
BNCGLN.BA

10 CLEARFRE (Q)/2:CLS

20 RD=0:PRINT" (Y)";

30 RD$=INKEY$:IFRD$<>"Y"THENGOTO30

40 LPRINT"J";INT(RND(1)*4)+1

50 XL=0:YL=0:XH=1050:YH=800:WT=120

60 C1=INT(RND(1)*20)+20:BA=0:CO=1

70 IFRD=1THENXL=0:YL=1000:XH=1050:YH=1800:WT=110

80 IFRD=2THENXL=1250:YL=1000:XH=2300:YH=1800:WT=110

90 IFRD=2THENXL=1250:YL=0:XH=2300:YH=180:WT=110

100 RD=RD+1:IFRD>4THENLPRINT"HO":GOTO20

110 LN=INT(RND(1)*35)+106:PRINTLN,

111 IFRD=1 THEN LN=LN+30

112 IFRD=3 THEN LN=LN-20

120 BC=((RND(1)*1)+.2)*11/10:IFBC<1.15ORBC>1.2THENGOTO120

130 BB=1.8

140 BB=BB^BC

150 LPRINT"M";INT(XL+BA);",";INT(YL+BA)

160 LPRINT"D";INT(XL+BA);",";INT(YL-BA);","INT(XH-BA);",";INT(YH-BA);",";INT(XH-BA);",";INT(YL+BA);",";INT(XH+BA);",";INT(YL+BA)

170	BA=BA+BB:IFBA<WITHENGOTO140

180 X=INT(RND(1)*(XH-XL-2*WI-20)+XL+WI+10

190 Y=INT(RND(1)*(YH-YL-2*WI-20)+YL+WI+10

200 Y3=INT(RND(1)*(YH-YL-2*WI-20)+YL+WI+10

210 X3=INT(RND(1)*(XH-XL-2*WI-20)+XL+WI+10

220 GOSUB320;GOSUB340;GOSUB360;GOSUB380;

230 X=X+X1:IFX>XH-WI-10ORX<XL+WI+10THENX=X-X1:GOSUB320:GOTO230

240 Y=Y+Y1:IFY>YH-WI-10ORY<YL+WI+10THENY=Y-Y1:GOSUB360:GOTO240

250 X3=X3+X2:IFX3>XH-WI-10ORX3<XL+WI+10THENX3=X3-X2:GOSUB340:GOTO250

260 Y3=Y3+Y2:IFY3>YH-WI-10ORY3<YL+WI+10THENY3=Y3-Y2:GOSUB380:GOTO260

270	LPRINT"M";X;",";Y:LPRINT"D";X3;",";Y3

280	IFRD>3ANDCT>LN-20THENBEEP

290 CT=CT+1:IFCT>LNTHENCT=0:GOTO50

300 CO=CO+1:IFCO>C1ANDCD<LN-10THENLPRINT"J";INT(RND(1)*5)+1:CO=0:C1=INT(RND(1)*20)+30

310	GOTO230

320 X1=INT(RND(1)*40)-20:IFX1<10ANDX1>-10THENGOTO320

330 RETURN

340 X2=INT(RND(1)*40)-20:IFX2<10ANDX2>-10THENGOTO340

350 RETURN

360 Y1=INT(RND(1)*40)-20:IFY1<10ANDY1>-10THENGOTO360

370 RETURN

380 Y2=INT(RND(1)*40)-20:IFY2<10ANDY2>-10THENGOTO380

390 RETURN
See also: Our letter to "Ripley's Believe It Or Not" on The World's Most 'Prolific' Artist
See also: If you are curious about what sort of art I drew before I discovered computers (in 1980) here is a 28K scan of a drawing I did in the late 1970's, by hand. Definite similarities...

Here are several other early drawings.
Related Material Outside this Web Site:
Dr. Pickover is the author of numerous books and essays on chaos, fractals, randomness, and graphics. He is editor of the Journal of Chaos and Graphics which published material on these drawings several years ago.
|