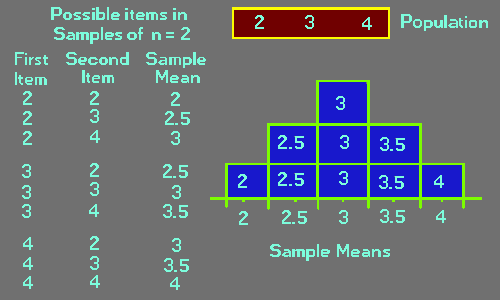
The accompanying illustration shows this population and its first two columns show each of the possible random samples (of size n = 2), that might be drawn from this population. If the first item is a 2, the second item can be either a 2 again, or it can be a 3 or a 4. Remember! We are drawing a random sample and our population is small, hence we are sampling with replacement. If our first item happened to be a 3, the second item might be a 2, a 3 again, or a 4 and if our first item happened to be a 4 the second item could be either a 2 or a 3 or a 4 again. As seen here, there are only 9 possible combinations of two numbers in a given sample and each of the combinations is equally likely. The same is not true, however, for the means of the samples. The third column in the illustration shows the means of each of the possible samples and the histogram shows the relative frequency of each of these means. In doing so the histogram provides a detailed representation of the sampling distribution of means (of size n = 2) that would be obtained if we were, in fact, able to draw an infinite number of random samples from the indicated population and graphically represent their frequency distribution in a histogram.
